Author: JoinHSHS

  • Mission Hills, San Diego

    Mission Hills, San Diego

    Mission Hills median real estate price is $1,306,943, which is more expensive than 94.1% of the neighborhoods in California and 99.0% of the neighborhoods in the U.S.

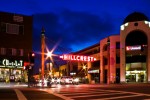
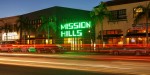
    Mission Hills is an urban neighborhood (based on population density) located in San Diego, California.

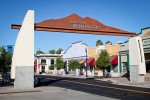
    Mission Hills real estate is primarily made up of medium sized (three or four bedroom) to large (four, five or more bedroom) single-family homes and apartment complexes/high-rise apartments. Most of the residential real estate is owner occupied. Many of the residences in the Mission Hills neighborhood are relatively historic, built no later than 1939, and in some cases, quite a bit earlier. A number of residences were also built between 1940 and 1969.

    Home and apartment vacancy rates are 9.5% in Mission Hills. NeighborhoodScout analysis shows that this rate is lower than 47.3% of the neighborhoods in the nation, approximately near the middle range for vacancies.

    Notable & Unique Neighborhood Characteristics

    When you see a neighborhood for the first time, the most important thing is often the way it looks, like its homes and its setting. Some places look the same, but they only reveal their true character after living in them for a while because they contain a unique mix of occupational or cultural groups. This neighborhood is very unique in some important ways, according to NeighborhoodScout’s exclusive exploration and analysis.

    Notable & Unique: People

    If you’re a regular supporter of the arts and enjoy outings to the theatre, weekend boutique-ing, or even a finely aged wine with dinner, than you’re in good company with the people of the Mission Hills neighborhood. This neighborhood is uniquely immersed with more “urban sophisticates” than 99.9% of neighborhoods across the country. The people here truly stand out as a class among their own. They are an exclusive community characterized by refined tastes, cultural inclinations, and the means to live well. Urban sophisticates live a big city lifestyle, whether or not they live in or near a big city. They are educated executives or managers by week, and serial patrons of the arts by weekend. If this lifestyle pertains to you, than you’ll certainly feel right at home in the Mission Hills neighborhood. In addition to being an excellent choice for urban sophisticates, this neighborhood is also a very good choice for active retirees, highly educated executives and families with school-aged children.

    In addition, wealth makes most things in life easier, and a few things harder. If you are wealthy and enjoy keeping up with the Jones’, this neighborhood will interest you. In fact, according to NeighborhoodScout’s research, the Mission Hills neighborhood is wealthier than 96.9% of the neighborhoods in the United States. Residents here are truly in a unique situation even when compared to other Americans, based on the sheer amount of wealth concentrated here. Even in times of economic downturn, residents of this neighborhood, as a group, suffered less and recovered more quickly. This is indeed a stand-out characteristic of this neighborhood.

    Also, some neighborhoods have residents that are more educated than others. But in this neighborhood there is a dramatic difference. NeighborhoodScout’s exclusive analysis reveals that 34.9% of the adults here have earned a Masters degree, medical degree, Ph.D. or law degree. This is a higher rate of people with a graduate degree than is found in 96.7% of U.S. neighborhoods, where the average American neighborhood has 8.4% of its adults with a graduate degree. If you are highly educated, you may have much in common with many of your neighbors here.

    Notable & Unique: Modes of Transportation

    A unique way of commuting is simply not to. And in the Mission Hills neighborhood, analysis shows that 17.3% of the residents work from home, avoiding a commute altogether. This may not seem like a large number, but it is a higher proportion of people working from home than is found in 99.1% of the neighborhoods in the United States. One thing NeighborhoodScout’s research reveals is that the wealthier and/or more isolated the neighborhood, the greater the proportion of residents who choose to work from home.

    Notable & Unique: Occupations

    Executives, managers and professionals make up 72.5% of the workforce in the Mission Hills neighborhood which, according to NeighborhoodScout’s exclusive analysis, is a higher proportion of such high-level people than is found in 98.6% of the neighborhoods in America. For this reason, this neighborhood really stands out as unique.

    Notable & Unique: Diversity

    Did you know that the Mission Hills neighborhood has more British and Croatian ancestry people living in it than nearly any neighborhood in America? It’s true! In fact, 2.0% of this neighborhood’s residents have British ancestry and 0.8% have Croatian ancestry.

    Notable & Unique: Real Estate

    If you find historic homes and neighborhoods attractive, you love the details, the history, and the charm, then you are sure to be interested in this neighborhood. With 62.0% of the residential real estate in the Mission Hills neighborhood built no later than 1939, and some built considerably earlier, this neighborhood has a greater concentration of historic residences than 96.0% of all neighborhoods in America. In this regard, this neighborhood truly stands out as special.

    The Neighbors: Income

    There are two complementary measures for understanding the income of a neighborhood’s residents: the average and the extremes. While a neighborhood may be relatively wealthy overall, it is equally important to understand the rate of people – particularly children – who are living at or below the federal poverty line, which is extremely low income. Some neighborhoods with a lower average income may actually have a lower childhood poverty rate than another with a higher average income, and this helps us understand the conditions and character of a neighborhood.

    The neighbors in the Mission Hills neighborhood in San Diego are wealthy, making it among the 15% highest income neighborhoods in America. NeighborhoodScout’s exclusive analysis reveals that this neighborhood has a higher income than 96.9% of the neighborhoods in America. In addition, 1.8% of the children seventeen and under living in this neighborhood are living below the federal poverty line, which is a lower rate of childhood poverty than is found in 87.1% of America’s neighborhoods.

    The Neighbors: Occupations

    A neighborhood is far different if it is dominated by enlisted military personnel rather than people who earn their living by farming. It is also different if most of the neighbors are clerical support or managers. What is wonderful is the sheer diversity of neighborhoods, allowing you to find the type that fits your lifestyle and aspirations.

    In the Mission Hills neighborhood, 72.5% of the working population is employed in executive, management, and professional occupations. The second most important occupational group in this neighborhood is sales and service jobs, from major sales accounts, to working in fast food restaurants, with 17.6% of the residents employed. Other residents here are employed in clerical, assistant, and tech support occupations (5.8%), and 4.1% in manufacturing and laborer occupations.

    The Neighbors: Ethnicity / Ancestry

    Boston’s Beacon Hill blue-blood streets, Brooklyn’s Orthodox Jewish enclaves, Los Angeles’ Persian neighborhoods. Each has its own culture derived primarily from the ancestries and culture of the residents who call these neighborhoods home. Likewise, each neighborhood in America has its own culture – some more unique than others – based on lifestyle, occupations, the types of households – and importantly – on the ethnicities and ancestries of the people who live in the neighborhood. Understanding where people came from, who their grandparents or great-grandparents were, can help you understand how a neighborhood is today.

    In the Mission Hills neighborhood in San Diego, CA, residents most commonly identify their ethnicity or ancestry as German (17.2%). There are also a number of people of English ancestry (15.9%), and residents who report Irish roots (10.8%), and some of the residents are also of Italian ancestry (8.1%), along with some Mexican ancestry residents (5.6%), among others. In addition, 10.6% of the residents of this neighborhood were born in another country.

    The Neighbors: Languages

    The most common language spoken in the Mission Hills neighborhood is English, spoken by 87.7% of households. Some people also speak Spanish (6.2%).

    Getting to Work

    How you get to work – car, bus, train or other means – and how much of your day it takes to do so is a large quality of life and financial issue. Especially with gasoline prices rising and expected to continue doing so, the length and means of one’s commute can be a financial burden. Some neighborhoods are physically located so that many residents have to drive in their own car, others are set up so many walk to work, or can take a train, bus, or bike. The greatest number of commuters in Mission Hills neighborhood spend between 15 and 30 minutes commuting one-way to work (39.1% of working residents), which is shorter than the time spent commuting to work for most Americans.

    Here most residents (92.8%) drive alone in a private automobile to get to work. In a neighborhood like this, as in most of the nation, many residents find owning a car useful for getting to work.

  • Hillcrest, San Diego

    Hillcrest, San Diego

    Hillcrest median real estate price is $699,090, which is more expensive than 71.2% of the neighborhoods in California and 93.4% of the neighborhoods in the U.S.

    The average rental price in Hillcrest is currently $1,776, based on NeighborhoodScout’s exclusive analysis. Rents here are currently lower in price than 45.4% of California neighborhoods.

    Hillcrest is a densely urban neighborhood (based on population density) located in San Diego, California.

    Hillcrest real estate is primarily made up of small (studio to two bedroom) to medium sized (three or four bedroom) apartment complexes/high-rise apartments and small apartment buildings. Most of the residential real estate is renter occupied. Many of the residences in the Hillcrest neighborhood are established but not old, having been built between 1970 and 1999. A number of residences were also built before 1940.

    Hillcrest has a 15.3% vacancy rate, which is well above average compared to other U.S. neighborhoods (higher than 75.7% of American neighborhoods). Most vacant housing here is vacant year round. This could either signal that there is a weak demand for real estate in the neighborhood or that large amount of new housing has been built and not yet occupied. Either way, if you live here, you may find many of the homes or apartments are empty.

    Notable & Unique Neighborhood Characteristics

    When you see a neighborhood for the first time, the most important thing is often the way it looks, like its homes and its setting. Some places look the same, but they only reveal their true character after living in them for a while because they contain a unique mix of occupational or cultural groups. This neighborhood is very unique in some important ways, according to NeighborhoodScout’s exclusive exploration and analysis.

    Notable & Unique: People

    The first thing that you’ll notice if you moved to this neighborhood is that an astounding 5.8% of the households are same sex couples. According to NeighborhoodScout’s analysis, this is a higher proportion of same sex households than in 99.8% of the neighborhoods in America. This is one indicator that this neighborhood is likely a gay-friendly neighborhood. So if you are looking for such a neighborhood, the Hillcrest neighborhood should definitely be on your list of places to consider.

    Notable & Unique: Real Estate

    The Hillcrest neighborhood is very unique in that it has one of the highest proportions of one, two, or no bedroom real estate of any neighborhood in America. Most neighborhoods have a mixture of home or apartment sizes from small to large, but here the concentration of studios and other small living spaces is at near-record heights. With 89.8% of the real estate here of this small size, this most assuredly is a notable feature that makes this neighborhood unique, along with just a handful of other neighborhoods in the U.S. that share this characteristic.

    In addition, one of the really unique and interesting things about the look and setting of the Hillcrest neighborhood is that it is almost entirely dominated by large apartment buildings, such as apartment complexes or high-rise apartments. 70.9% of the residential real estate here is classified as such. This puts this neighborhood on the map as having a higher proportion of large apartment buildings than 95.9% of all neighborhoods in America.

    Notable & Unique: Modes of Transportation

    Would you like to be able to ride your bike to work? If you are attracted to the idea of getting a little exercise of the two-wheeled type while reducing your carbon footprint, bicycling to work might be the answer. But which neighborhood you live in can make this either impossible, or alternatively, a great and realistic option. NeighborhoodScout’s analysis revealed that the Hillcrest neighborhood is a fantastic option for bicycle commuters, as 5.1% of commuters here do ride their bikes to and from work on a daily basis. This is a higher amount than we found in 97.5% of the neighborhoods in America.

    Also, in the Hillcrest neighborhood, walking to work is a real option for many. In fact, NeighborhoodScout’s exclusive research reveals walking to and from work is the chosen way to commute for 12.5% of residents here. This is a higher proportion of walking commuters than we found in 95.4% of American neighborhoods. Get ready to put on your walking shoes if you move here!

    Notable & Unique: Diversity

    Did you know that the Hillcrest neighborhood has more Swiss and Danish ancestry people living in it than nearly any neighborhood in America? It’s true! In fact, 1.8% of this neighborhood’s residents have Swiss ancestry and 2.4% have Danish ancestry.

    Hillcrest is also pretty special linguistically. Significantly, 0.4% of its residents five years old and above primarily speak Mon-Khmer, which is the dominant language of Cambodia, at home. While this may seem like a small percentage, it is higher than 96.3% of the neighborhoods in America.

    Notable & Unique: Occupations

    Executives, managers and professionals make up 63.6% of the workforce in the Hillcrest neighborhood which, according to NeighborhoodScout’s exclusive analysis, is a higher proportion of such high-level people than is found in 95.1% of the neighborhoods in America. For this reason, this neighborhood really stands out as unique.

    The Neighbors: Income

    There are two complementary measures for understanding the income of a neighborhood’s residents: the average and the extremes. While a neighborhood may be relatively wealthy overall, it is equally important to understand the rate of people – particularly children – who are living at or below the federal poverty line, which is extremely low income. Some neighborhoods with a lower average income may actually have a lower childhood poverty rate than another with a higher average income, and this helps us understand the conditions and character of a neighborhood.

    The neighbors in the Hillcrest neighborhood in San Diego are upper-middle income, making it an above average income neighborhood. NeighborhoodScout’s exclusive analysis reveals that this neighborhood has a higher income than 77.3% of the neighborhoods in America. With 26.0% of the children here below the federal poverty line, this neighborhood has a higher rate of childhood poverty than 66.7% of U.S. neighborhoods.

    The Neighbors: Occupations

    What we choose to do for a living reflects who we are. Each neighborhood has a different mix of occupations represented, and together these tell you about the neighborhood and help you understand if this neighborhood may fit your lifestyle.

    In the Hillcrest neighborhood, 63.6% of the working population is employed in executive, management, and professional occupations. The second most important occupational group in this neighborhood is sales and service jobs, from major sales accounts, to working in fast food restaurants, with 20.0% of the residents employed. Other residents here are employed in clerical, assistant, and tech support occupations (9.9%), and 6.5% in manufacturing and laborer occupations.

    The Neighbors: Ethnicity / Ancestry

    Boston’s Beacon Hill blue-blood streets, Brooklyn’s Orthodox Jewish enclaves, Los Angeles’ Persian neighborhoods. Each has its own culture derived primarily from the ancestries and culture of the residents who call these neighborhoods home. Likewise, each neighborhood in America has its own culture – some more unique than others – based on lifestyle, occupations, the types of households – and importantly – on the ethnicities and ancestries of the people who live in the neighborhood. Understanding where people came from, who their grandparents or great-grandparents were, can help you understand how a neighborhood is today.

    In the Hillcrest neighborhood in San Diego, CA, residents most commonly identify their ethnicity or ancestry as German (14.5%). There are also a number of people of Irish ancestry (12.6%), and residents who report Mexican roots (11.6%), and some of the residents are also of English ancestry (10.8%), along with some Italian ancestry residents (5.4%), among others. In addition, 12.9% of the residents of this neighborhood were born in another country.

    The Neighbors: Languages

    The languages spoken by people in this neighborhood are diverse. These are tabulated as the languages people preferentially speak when they are at home with their families. The most common language spoken in the Hillcrest neighborhood is English, spoken by 80.7% of households. Other important languages spoken here include Spanish and French.

    Getting to Work

    Even if your neighborhood is walkable, you may still have to drive to your place of work. Some neighborhoods are located where many can get to work in just a few minutes, while others are located such that most residents have a long and arduous commute. The greatest number of commuters in Hillcrest neighborhood spend between 15 and 30 minutes commuting one-way to work (46.5% of working residents), which is shorter than the time spent commuting to work for most Americans.

    Here most residents (75.4%) drive alone in a private automobile to get to work. In addition, quite a number also hop out the door and walk to work to get to work (12.5%) and 5.1% of residents also bicycle for their daily commute. In a neighborhood like this, as in most of the nation, many residents find owning a car useful for getting to work.

  • North Park, San Diego

    North Park, San Diego

    30th St / University Ave median real estate price is $774,186, which is more expensive than 76.7% of the neighborhoods in California and 95.1% of the neighborhoods in the U.S.

    The average rental price in 30th St / University Ave is currently $1,681, based on NeighborhoodScout’s exclusive analysis. Rents here are currently lower in price than 50.5% of California neighborhoods.

    30th St / University Ave is an urban neighborhood (based on population density) located in San Diego, California.

    30th St / University Ave real estate is primarily made up of small (studio to two bedroom) to medium sized (three or four bedroom) single-family homes and apartment complexes/high-rise apartments. Most of the residential real estate is occupied by a mixture of owners and renters. Many of the residences in the 30th St / University Ave neighborhood are relatively historic, built no later than 1939, and in some cases, quite a bit earlier. A number of residences were also built between 1970 and 1999.

    Real estate vacancies in 30th St / University Ave are 5.0%, which is lower than one will find in 75.5% of American neighborhoods. Demand for real estate in 30th St / University Ave is above average for the U.S., and may signal some demand for either price increases or new construction of residential product for this neighborhood.

    Notable & Unique Neighborhood Characteristics

    When you see a neighborhood for the first time, the most important thing is often the way it looks, like its homes and its setting. Some places look the same, but they only reveal their true character after living in them for a while because they contain a unique mix of occupational or cultural groups. This neighborhood is very unique in some important ways, according to NeighborhoodScout’s exclusive exploration and analysis.

    Notable & Unique: People

    30th St / University Ave has the amazing distinction of housing more same sex couples living together than 98.1% of neighborhoods in the U.S. If you are seeking such a neighborhood, NeighborhoodScout’s analysis shows that this is one place that you should consider.

    Notable & Unique: Diversity

    Significantly, 1.5% of its residents five years old and above primarily speak German at home. While this may seem like a small percentage, it is higher than 96.0% of the neighborhoods in America.

    Notable & Unique: Occupations

    The 30th St / University Ave neighborhood stands out nationally for having a greater proportion of its residents active in the military than 95.4% of other U.S. neighborhoods. If you come here, you will notice military people active in their jobs, going to and from work, and in plain clothes out and about the neighborhood.

    Notable & Unique: Modes of Transportation

    In the 30th St / University Ave neighborhood, many people’s commute means walking from the bedroom to the home office. NeighborhoodScout’s analysis found that 11.2% of residents worked from home. This may not seem like a large number, but Scout’s research shows that this is a higher percentage of people working from home than 95.1% of the neighborhoods in America. Often people who work from home are engaged in the creative or technological economy, such as is found in areas around Boston, and in Silicon Valley. Other times, people may be engaged in other businesses like trading stocks from home, or running a small beauty salon.

    The Neighbors: Income

    How wealthy a neighborhood is, from very wealthy, to middle income, to low income is very formative with regard to the personality and character of a neighborhood. Equally important is the rate of people, particularly children, who live below the federal poverty line. In some wealthy gated communities, the areas immediately surrounding can have high rates of childhood poverty, which indicates other social issues. NeighborhoodScout’s analysis reveals both aspects of income and poverty for this neighborhood.

    The neighbors in the 30th St / University Ave neighborhood in San Diego are upper-middle income, making it an above average income neighborhood. NeighborhoodScout’s exclusive analysis reveals that this neighborhood has a higher income than 65.0% of the neighborhoods in America. In addition, 11.6% of the children seventeen and under living in this neighborhood are living below the federal poverty line, which is a lower rate of childhood poverty than is found in 60.6% of America’s neighborhoods.

    The Neighbors: Occupations

    A neighborhood is far different if it is dominated by enlisted military personnel rather than people who earn their living by farming. It is also different if most of the neighbors are clerical support or managers. What is wonderful is the sheer diversity of neighborhoods, allowing you to find the type that fits your lifestyle and aspirations.

    In the 30th St / University Ave neighborhood, 62.6% of the working population is employed in executive, management, and professional occupations. The second most important occupational group in this neighborhood is sales and service jobs, from major sales accounts, to working in fast food restaurants, with 23.3% of the residents employed. Other residents here are employed in government jobs, whether they are in local, state, or federal positions (9.2%), and 8.5% in clerical, assistant, and tech support occupations.

    The Neighbors: Ethnicity / Ancestry

    Culture is the shared learned behavior of peoples. Undeniably, different ethnicities and ancestries have different cultural traditions, and as a result, neighborhoods with concentrations of residents of one or another ethnicities or ancestries will express those cultures. It is what makes the North End in Boston so fun to visit for the Italian restaurants, bakeries, culture, and charm, and similarly, why people enjoy visiting Chinatown in San Francisco.

    In the 30th St / University Ave neighborhood in San Diego, CA, residents most commonly identify their ethnicity or ancestry as Mexican (19.5%). There are also a number of people of English ancestry (10.4%), and residents who report Irish roots (10.4%), and some of the residents are also of German ancestry (9.7%), along with some Italian ancestry residents (7.2%), among others.

    The Neighbors: Languages

    The most common language spoken in the 30th St / University Ave neighborhood is English, spoken by 80.1% of households. Some people also speak Spanish (12.1%).

    Getting to Work

    Even if your neighborhood is walkable, you may still have to drive to your place of work. Some neighborhoods are located where many can get to work in just a few minutes, while others are located such that most residents have a long and arduous commute. The greatest number of commuters in 30th St / University Ave neighborhood spend between 15 and 30 minutes commuting one-way to work (50.5% of working residents), which is shorter than the time spent commuting to work for most Americans.

    Here most residents (78.6%) drive alone in a private automobile to get to work. In addition, quite a number also hop out the door and walk to work to get to work (7.7%) and 7.4% of residents also carpool with coworkers, friends, or neighbors for their daily commute. In a neighborhood like this, as in most of the nation, many residents find owning a car useful for getting to work.

  • Kensington, San Diego

    Kensington, San Diego

    Fairmount Ave / Camino Del Rio S median real estate price is $939,887, which is more expensive than 85.3% of the neighborhoods in California and 97.1% of the neighborhoods in the U.S.

    The average rental price in Fairmount Ave / Camino Del Rio S is currently $3,892, based on NeighborhoodScout’s exclusive analysis. The average rental cost in this neighborhood is higher than 97.1% of the neighborhoods in California.

    Fairmount Ave / Camino Del Rio S is a suburban neighborhood (based on population density) located in San Diego, California.

    Fairmount Ave / Camino Del Rio S real estate is primarily made up of medium sized (three or four bedroom) to small (studio to two bedroom) single-family homes and townhomes. Most of the residential real estate is owner occupied. Many of the residences in the Fairmount Ave / Camino Del Rio S neighborhood are relatively historic, built no later than 1939, and in some cases, quite a bit earlier. A number of residences were also built between 1940 and 1969.

    Home and apartment vacancy rates are 9.0% in Fairmount Ave / Camino Del Rio S. NeighborhoodScout analysis shows that this rate is lower than 50.4% of the neighborhoods in the nation, approximately near the middle range for vacancies.

    Notable & Unique Neighborhood Characteristics

    When you see a neighborhood for the first time, the most important thing is often the way it looks, like its homes and its setting. Some places look the same, but they only reveal their true character after living in them for a while because they contain a unique mix of occupational or cultural groups. This neighborhood is very unique in some important ways, according to NeighborhoodScout’s exclusive exploration and analysis.

    Notable & Unique: People

    Wealth makes most things in life easier, and a few things harder. If you are wealthy and enjoy keeping up with the Jones’, this neighborhood will interest you. In fact, according to NeighborhoodScout’s research, the Fairmount Ave / Camino Del Rio S neighborhood is wealthier than 96.5% of the neighborhoods in the United States. Residents here are truly in a unique situation even when compared to other Americans, based on the sheer amount of wealth concentrated here. Even in times of economic downturn, residents of this neighborhood, as a group, suffered less and recovered more quickly. This is indeed a stand-out characteristic of this neighborhood. As one would expect in a considerably wealthy neighborhood such as this, Fairmount Ave / Camino Del Rio S also has one of the lowest ratings of child poverty in the nation.

    In addition, the first thing that you’ll notice if you moved to this neighborhood is that an astounding 3.9% of the households are same sex couples. According to NeighborhoodScout’s analysis, this is a higher proportion of same sex households than in 99.4% of the neighborhoods in America. This is one indicator that this neighborhood is likely a gay-friendly neighborhood. So if you are looking for such a neighborhood, the Fairmount Ave / Camino Del Rio S neighborhood should definitely be on your list of places to consider.

    Also, think about the people you know personally. How many of them would purchase box seats to opening night at the symphony? How many of them regularly attend gallery openings, or are the first to reserve tickets to opening night at the ballet? If they’re like most of us, they don’t do any of these things. But if you’re among an exclusive crowd of wealthy and refined patrons of the arts, then you’ll feel right at home in the Fairmount Ave / Camino Del Rio S neighborhood: a neighborhood in which more “urban sophisticates” live than 99.2% of neighborhoods across the U.S. Here, your neighbors are defined as having urbane tastes in literature, music, live theatre and the arts. They are wealthy, educated, travel in style, and live a big city lifestyle whether or not they live in or near a big city. In addition to being an excellent choice for urban sophisticates, this neighborhood is also a very good choice for active retirees.

    Finally, some neighborhoods have residents that are more educated than others. But in this neighborhood there is a dramatic difference. NeighborhoodScout’s exclusive analysis reveals that 32.4% of the adults here have earned a Masters degree, medical degree, Ph.D. or law degree. This is a higher rate of people with a graduate degree than is found in 95.7% of U.S. neighborhoods, where the average American neighborhood has 8.4% of its adults with a graduate degree. If you are highly educated, you may have much in common with many of your neighbors here.

    Notable & Unique: Diversity

    Did you know that the Fairmount Ave / Camino Del Rio S neighborhood has more Scottish and Dutch ancestry people living in it than nearly any neighborhood in America? It’s true! In fact, 6.0% of this neighborhood’s residents have Scottish ancestry and 4.1% have Dutch ancestry.

    Fairmount Ave / Camino Del Rio S is also pretty special linguistically. Significantly, 2.5% of its residents five years old and above primarily speak Tagalog, which is the first language of the Philippine region, at home. While this may seem like a small percentage, it is higher than 95.0% of the neighborhoods in America.

    Notable & Unique: Modes of Transportation

    A unique way of commuting is simply not to. And in the Fairmount Ave / Camino Del Rio S neighborhood, analysis shows that 13.9% of the residents work from home, avoiding a commute altogether. This may not seem like a large number, but it is a higher proportion of people working from home than is found in 97.8% of the neighborhoods in the United States. One thing NeighborhoodScout’s research reveals is that the wealthier and/or more isolated the neighborhood, the greater the proportion of residents who choose to work from home.

    Notable & Unique: Real Estate

    If you find historic homes and neighborhoods attractive, you love the details, the history, and the charm, then you are sure to be interested in this neighborhood. With 59.8% of the residential real estate in the Fairmount Ave / Camino Del Rio S neighborhood built no later than 1939, and some built considerably earlier, this neighborhood has a greater concentration of historic residences than 95.3% of all neighborhoods in America. In this regard, this neighborhood truly stands out as special.

  • San Fransisco, California

    San Fransisco, California

    San Francisco is a very large coastal city (i.e. on the ocean, a bay, or inlet) located in the state of California. With a population of 864,816 people and 198 constituent neighborhoods, San Francisco is the fourth largest community in California. San Francisco has a large stock of pre-World War II architecture, making it one of the older and more historic cities in the country.

    San Francisco home prices are not only among the most expensive in California, but San Francisco real estate also consistently ranks among the most expensive in America.

    San Francisco is a decidedly white-collar city, with fully 90.98% of the workforce employed in white-collar jobs, well above the national average. Overall, San Francisco is a city of professionals, managers, and sales and office workers. There are especially a lot of people living in San Francisco who work in management occupations (13.72%), sales jobs (10.37%), and office and administrative support (10.16%).

    Also of interest is that San Francisco has more people living here who work in computers and math than 95% of the places in the US.

    Of important note, San Francisco is also a city of artists. San Francisco has more artists, designers and people working in media than 90% of the communities in America. This concentration of artists helps shape San Francisco’s character.

    San Francisco is also nautical, which means that parts of it are somewhat historic and touch the ocean or tidal bodies of water, such as inlets and bays. Quite often, nautical areas such as these attract visitors and locals who come to enjoy the scenery and various waterfront activities.

    One downside of living in San Francisco, however, is that residents on average have to contend with a long commute, spending on average 32.76 minutes every day commuting to work. It is, however, a pedestrian-friendly city. Many of its neighborhoods are dense enough and have amenities close enough together that people find it feasible to get around on foot. In addition, local public transit is widely used. For those who would prefer to avoid driving entirely and leave their car at home, it may be an option to use the transit instead.

    San Francisco is a big city, and with that comes lots of benefits. One benefit is that most big cities have public transit, but San Francisco really shines when it comes to the extensiveness and use of its public transit system. More than most large American cities, San Francisco citizens use public transit daily to get to and from work. And while there are transportation options, most people in San Francisco ride the bus. Whereas in some cities one is destined to sit in traffic every morning to get to work and every evening to get home, in San Francisco a lot leave their cars at home (if they even choose to own one), and hop a ride on the bus.

    Do you have a 4-year college degree or graduate degree? If so, you may feel right at home in San Francisco. 53.83% of adults here have a 4-year degree or graduate degree, whereas the national average for all cities and towns is just 21.84%.

    The per capita income in San Francisco in 2010 was $52,220, which is wealthy relative to California and the nation. This equates to an annual income of $208,880 for a family of four. However, San Francisco contains both very wealthy and poor people as well.

    San Francisco is an extremely ethnically-diverse city. The people who call San Francisco home describe themselves as belonging to a variety of racial and ethnic groups. The greatest number of San Francisco residents report their race to be White, followed by Asian. San Francisco also has a sizeable Hispanic population (people of Hispanic origin can be of any race). People of Hispanic or Latino origin account for 15.30% of the city’s residents. Important ancestries of people in San Francisco include German, English, Italian, and European.

    Foreign born people are also an important part of San Francisco’s cultural character, accounting for 35.14% of the city’s population.

    The most common language spoken in San Francisco is English. Other important languages spoken here include Chinese and Spanish.

    Just for our own edification, we took the most expensive Bay Area ZIPs on both lists and looked at their average sale price on Redfin for all of 2016:

    Atherton, 92027 ($6.09 million; #3 Forbes, #2 PropertyShark)
    Palo Alto, 94301 ($2.93 million; #48 Forbes, #8 PS)
    Ross, 94957, ($2.82 million; N/A Forbes, #13 PS)
    Los Altos, 94022 ($2.8 million; #46 Forbes, #9 PS)
    Portola Valley, 94028 ($2.8 million; #51 Forbes, #10 PS)
    Los Altos, 94024 ($2.62 million; #68 Forbes, #15 PS)
    Los Gatos, 95030 ($2.3 million; #89 Forbes, #25 PS)
    Stanford*, 94305 ($2.28 million; N/A Forbes, #39 PS)
    Burlingame, 94010 ($2.23 million; #182 Forbes, #22 PS)
    Palo Alto, 94306 ($2.22 million; #143 Forbes, #23 PS)
    Saratoga, 95070 ($2.22 million; $85 Forbes, #28 PS)
    San Francisco, 94123 ($2.06 million; #61 Forbes, #24 PS)
    Tiburon, 94920 ($1.89 million; #54 Forbes, #31 PS)
    San Francisco, 94118 ($1.82 million; #128 Forbes, #37 PS)
    Menlo Park, 94025 ($1.8 million; #134 Forbes, #38 PS)

    (*Note that Stanford’s sample size of only a little more than a dozen homes sold isn’t particularly useful or reliable, which is probably why it didn’t make Forbes’ list.)

  • Berkeley, California

    Berkeley, California

    Berkeley is a larger medium-sized coastal city (i.e. on the ocean, a bay, or inlet) located in the state of California. With a population of 120,972 people and 35 constituent neighborhoods, Berkeley is the 52nd largest community in California. Berkeley has a large stock of pre-World War II architecture, making it one of the older and more historic cities in the country.

    Berkeley home prices are not only among the most expensive in California, but Berkeley real estate also consistently ranks among the most expensive in America.

    Berkeley is a decidedly white-collar city, with fully 93.96% of the workforce employed in white-collar jobs, well above the national average. Overall, Berkeley is a city of professionals, managers, and sales and office workers. There are especially a lot of people living in Berkeley who work in teaching (14.27%), management occupations (12.50%), and office and administrative support (9.49%).

    And if you like science, one thing you’ll find is that Berkeley has lots of scientists living in town – whether they be life scientists, physical scientists (like astronomers), or social scientists (like geographers!). So, if you’re scientific-minded, you might like it here too.

    Also of interest is that Berkeley has more people living here who work in computers and math than 95% of the places in the US.

    Of important note, Berkeley is also a city of artists. Berkeley has more artists, designers and people working in media than 90% of the communities in America. This concentration of artists helps shape Berkeley’s character.

    Telecommuters are a relatively large percentage of the workforce: 10.61% of people work from home. While this number may seem small overall, as a fraction of the total workforce it is high relative to the nation. These workers are often telecommuters who work in knowledge-based, white-collar professions. For example, Silicon Valley has large numbers of people who telecommute. Other at-home workers may be self-employed people who operate small businesses out of their homes.

    Berkeley is made interesting by being both a reasonably big city and having a major college student population: students here will find that the city provides a lot of amenities, culture, and opportunities for them. Berkeley is more than just a college town, however, though the thousands of students certainly are a major part of the character of the city, as well as a contributor to the local economy.

    One of the nice things about Berkeley is that it is nautical, which means that parts of it are somewhat historic and touch the ocean or tidal bodies of water, such as inlets and bays. Because of this, visitors and locals will often go to these areas to take in the scenery or to enjoy waterfront activities.

    For the size of the city, public transportation in Berkeley is quite heavily used. Mostly, people who use it for their daily commute are taking the subway. For Berkeley, the benefits are reduced air pollution and congestion on the highways.

    If knowledge is power, Berkeley is a pretty powerful place. 70.93% of the adults in Berkeley have earned a 4-year college degree, masters degree, MD, law degree, or even PhD. Compare that to the national average of 21.84% for all cities and towns.

    The per capita income in Berkeley in 2010 was $42,627, which is wealthy relative to California and the nation. This equates to an annual income of $170,508 for a family of four. However, Berkeley contains both very wealthy and poor people as well.

    Berkeley is an extremely ethnically-diverse city. The people who call Berkeley home describe themselves as belonging to a variety of racial and ethnic groups. The greatest number of Berkeley residents report their race to be White, followed by Asian. Berkeley also has a sizeable Hispanic population (people of Hispanic origin can be of any race). People of Hispanic or Latino origin account for 11.44% of the city’s residents. Important ancestries of people in Berkeley include English, Irish, Italian, and European.

    Berkeley also has a high percentage of its population that was born in another country: 20.95%.

    The most common language spoken in Berkeley is English. Other important languages spoken here include Spanish and Chinese.

  • Napa, California

    Napa, California

    Napa is a larger medium-sized city located in the state of California. With a population of 80,434 people and 28 constituent neighborhoods, Napa is the 100th largest community in California.

    Housing costs in Napa are among some of the highest in the nation, although real estate prices here don’t compare to real estate prices in the most expensive communities in California.

    Unlike some cities, Napa isn’t mainly white- or blue-collar. Instead, the most prevalent occupations for people in Napa are a mix of both white- and blue-collar jobs. Overall, Napa is a city of service providers, sales and office workers, and professionals. There are especially a lot of people living in Napa who work in office and administrative support (11.52%), management occupations (10.78%), and sales jobs (9.97%).

    The overall education level of Napa is somewhat higher than in the average US city of 21.84%: 28.73% of adults 25 and older in the city have at least a bachelor’s degree.

    The per capita income in Napa in 2010 was $32,520, which is upper middle income relative to California, and wealthy relative to the rest of the US. This equates to an annual income of $130,080 for a family of four. However, Napa contains both very wealthy and poor people as well.

    Napa is an extremely ethnically-diverse city. The people who call Napa home describe themselves as belonging to a variety of racial and ethnic groups. The greatest number of Napa residents report their race to be White, followed by Asian. Napa also has a sizeable Hispanic population (people of Hispanic origin can be of any race). People of Hispanic or Latino origin account for 39.33% of the city’s residents. Important ancestries of people in Napa include Irish, English, Italian, and French .

    Napa also has a high percentage of its population that was born in another country: 23.24%.

    The most common language spoken in Napa is English. Other important languages spoken here include Spanish and French.

  • Silicon Valley, California

    Silicon Valley, California

    With the wide assortment of top tech companies currently headquartered in Silicon Valley, it should come as no surprise that some of the country’s wealthiest people also call the area home.

    The 20 Most Expensive Zip Codes in Silicon Valley

    1. 94027 – San Mateo Atherton
    2. 94022 – Santa Clara Los Altos Hills
    3. 94024 – Santa Clara Los Altos Hills
    4. 94301 – Santa Clara Palo Alto
    5. 94028 – San Mateo Portola Valley
    6. 94010 – San Mateo Hillsborough
    7. 94306 – Santa Clara Palo Alto
    8. 95070 – Santa Clara Saratoga
    9. 95030 – Santa Clara Los Gatos
    10. 95014 – Santa Clara Cupertino
    11. 94062 – San Mateo Redwood City
    12. 94025 – San Mateo Menlo Park
    13. 94040 – Santa Clara Mountain View
    14. 94087 – Santa Clara Sunnyvale
    15. 94402 – San Mateo San Mateo
    16. 95032 – Santa Clara Los Gatos
    17. 94070 – San Mateo San Carlos
    18. 94002 – San Mateo Belmont
    19. 94041 – Santa Clara Mountain View
    20. 95120 – Santa Clara San Jose

  • Santa Monica, California

    Santa Monica, California

    Santa Monica is a larger medium-sized coastal city (i.e. on the ocean, a bay, or inlet) located in the state of California. With a population of 93,220 people and 19 constituent neighborhoods, Santa Monica is the 80th largest community in California.

    Santa Monica home prices are not only among the most expensive in California, but Santa Monica real estate also consistently ranks among the most expensive in America.

    Santa Monica is a decidedly white-collar city, with fully 95.18% of the workforce employed in white-collar jobs, well above the national average. Overall, Santa Monica is a city of professionals, managers, and sales and office workers. There are especially a lot of people living in Santa Monica who work in management occupations (16.74%), art, media, and design (12.84%), and sales jobs (10.46%).

    Of important note, Santa Monica is also a city of artists. Santa Monica has more artists, designers and people working in media than 90% of the communities in America. This concentration of artists helps shape Santa Monica’s character.

    Also of interest is that Santa Monica has more people living here who work in computers and math than 95% of the places in the US.

    One interesting thing about the economy is that relatively large numbers of people worked from their home: 10.80% of the workforce. While this number may seem small overall, as a fraction of the total workforce this is high compared to the rest of the county. These workers are often telecommuters who work in knowledge-based, white-collar professions. For example, Silicon Valley has large numbers of people who telecommute. Other at-home workers may be self-employed people who operate small businesses out of their homes.

    Santa Monica is also nautical, which means that parts of it are somewhat historic and touch the ocean or tidal bodies of water, such as inlets and bays. Quite often, nautical areas such as these attract visitors and locals who come to enjoy the scenery and various waterfront activities.

    Like elsewhere in America, most people in Santa Monica use a private automobile to get to work. But notably, a substantial number of Santa Monica‘s citizens do make use of public transit in their daily commute, primarily riding the bus. This helps more people get to work with less air pollution, and require fewer highways to get them there.

    Do you have a 4-year college degree or graduate degree? If so, you may feel right at home in Santa Monica. 65.27% of adults here have a 4-year degree or graduate degree, whereas the national average for all cities and towns is just 21.84%.

    The per capita income in Santa Monica in 2010 was $59,704, which is wealthy relative to California and the nation. This equates to an annual income of $238,816 for a family of four. However, Santa Monica contains both very wealthy and poor people as well.

    Santa Monica is an extremely ethnically-diverse city. The people who call Santa Monica home describe themselves as belonging to a variety of racial and ethnic groups. The greatest number of Santa Monica residents report their race to be White, followed by Asian. Santa Monica also has a sizeable Hispanic population (people of Hispanic origin can be of any race). People of Hispanic or Latino origin account for 15.38% of the city’s residents. Important ancestries of people in Santa Monica include Irish, English, Russian, and Italian.

    In addition, Santa Monica has a lot of people living here who were born outside of the US (23.29%).

    The most common language spoken in Santa Monica is English. Other important languages spoken here include Spanish and Chinese.


  • Brentwood, California

    Brentwood, California

    Brentwood median real estate price is $3,116,532, which is more expensive than 99.5% of the neighborhoods in California and 99.9% of the neighborhoods in the U.S.

    The average rental price in Brentwood is currently $2,778, based on NeighborhoodScout’s exclusive analysis. The average rental cost in this neighborhood is higher than 86.1% of the neighborhoods in California.

    Brentwood is an urban neighborhood (based on population density) located in Los Angeles, California.

    Brentwood real estate is primarily made up of medium sized (three or four bedroom) to large (four, five or more bedroom) single-family homes and apartment complexes/high-rise apartments. Most of the residential real estate is owner occupied. Many of the residences in the Brentwood neighborhood are older, well-established, built between 1940 and 1969. A number of residences were also built before 1940.

    Home and apartment vacancy rates are 10.4% in Brentwood. NeighborhoodScout analysis shows that this rate is lower than 42.8% of the neighborhoods in the nation, approximately near the middle range for vacancies.

    Notable & Unique Neighborhood Characteristics

    Many things matter about a neighborhood, but the first thing most people notice is the way a neighborhood looks and its particular character. For example, one might notice whether the buildings all date from a certain time period or whether shop signs are in multiple languages. This particular neighborhood in Los Angeles, the Brentwood neighborhood, has some outstanding things about the way it looks and its way of life that are worth highlighting.

    Notable & Unique: People

    Wealth makes most things in life easier, and a few things harder. If you are wealthy and enjoy keeping up with the Jones’, this neighborhood will interest you. In fact, according to NeighborhoodScout’s research, the Brentwood neighborhood is wealthier than 99.8% of the neighborhoods in the United States. Residents here are truly in a unique situation even when compared to other Americans, based on the sheer amount of wealth concentrated here. Even in times of economic downturn, residents of this neighborhood, as a group, suffered less and recovered more quickly. This is indeed a stand-out characteristic of this neighborhood. As one would expect in a considerably wealthy neighborhood such as this, Brentwood also has one of the lowest ratings of child poverty in the nation.

    In addition, if you’re a regular supporter of the arts and enjoy outings to the theatre, weekend boutique-ing, or even a finely aged wine with dinner, than you’re in good company with the people of the Brentwood neighborhood. This neighborhood is uniquely immersed with more “urban sophisticates” than 99.7% of neighborhoods across the country. The people here truly stand out as a class among their own. They are an exclusive community characterized by refined tastes, cultural inclinations, and the means to live well. Urban sophisticates live a big city lifestyle, whether or not they live in or near a big city. They are educated executives or managers by week, and serial patrons of the arts by weekend. If this lifestyle pertains to you, than you’ll certainly feel right at home in the Brentwood neighborhood. In addition to being an excellent choice for urban sophisticates, this neighborhood is also a very good choice for highly educated executives, active retirees and families with school-aged children.

    Also, do you like to read, write, and learn? Are you curious about the world? If so, this neighborhood may be a good fit for you. NeighborhoodScout’s research revealed that a full 84.2% of the adults living in the Brentwood neighborhood have earned at least a bachelor’s degree. This is a higher rate than NeighborhoodScout found in 99.4% of U.S. neighborhoods. In this way, this neighborhood truly stands out.

    Notable & Unique: Diversity

    Did you know that the Brentwood neighborhood has more Iranian and Eastern European ancestry people living in it than nearly any neighborhood in America? It’s true! In fact, 9.2% of this neighborhood’s residents have Iranian ancestry and 5.2% have Eastern European ancestry.

    Brentwood is also pretty special linguistically. Significantly, 9.2% of its residents five years old and above primarily speak Persian at home. While this may seem like a small percentage, it is higher than 99.9% of the neighborhoods in America.

    Notable & Unique: Occupations

    Executives, managers and professionals make up 78.1% of the workforce in the Brentwood neighborhood which, according to NeighborhoodScout’s exclusive analysis, is a higher proportion of such high-level people than is found in 99.5% of the neighborhoods in America. For this reason, this neighborhood really stands out as unique.

    Furthermore, with 1.7% of employed workers living in the Brentwood neighborhood active in the military, this neighborhood has the distinction of having a higher proportion of people in the military than 96.8% of American neighborhoods. This is a major shaper of the neighborhood’s culture and character.

    Notable & Unique: Modes of Transportation

    In the Brentwood neighborhood, many people’s commute means walking from the bedroom to the home office. NeighborhoodScout’s analysis found that 19.0% of residents worked from home. This may not seem like a large number, but Scout’s research shows that this is a higher percentage of people working from home than 99.3% of the neighborhoods in America. Often people who work from home are engaged in the creative or technological economy, such as is found in areas around Boston, and in Silicon Valley. Other times, people may be engaged in other businesses like trading stocks from home, or running a small beauty salon.

    The Neighbors: Income

    There are two complementary measures for understanding the income of a neighborhood’s residents: the average and the extremes. While a neighborhood may be relatively wealthy overall, it is equally important to understand the rate of people – particularly children – who are living at or below the federal poverty line, which is extremely low income. Some neighborhoods with a lower average income may actually have a lower childhood poverty rate than another with a higher average income, and this helps us understand the conditions and character of a neighborhood.

    The neighbors in the Brentwood neighborhood in Los Angeles are wealthy, making it among the 15% highest income neighborhoods in America. NeighborhoodScout’s exclusive analysis reveals that this neighborhood has a higher income than 99.8% of the neighborhoods in America. In addition, 0.0% of the children seventeen and under living in this neighborhood are living below the federal poverty line, which is a lower rate of childhood poverty than is found in 100.0% of America’s neighborhoods.

    The Neighbors: Occupations

    A neighborhood is far different if it is dominated by enlisted military personnel rather than people who earn their living by farming. It is also different if most of the neighbors are clerical support or managers. What is wonderful is the sheer diversity of neighborhoods, allowing you to find the type that fits your lifestyle and aspirations.

    In the Brentwood neighborhood, 78.1% of the working population is employed in executive, management, and professional occupations. The second most important occupational group in this neighborhood is sales and service jobs, from major sales accounts, to working in fast food restaurants, with 13.5% of the residents employed. Other residents here are employed in clerical, assistant, and tech support occupations (6.4%).

    The Neighbors: Ethnicity / Ancestry

    Boston’s Beacon Hill blue-blood streets, Brooklyn’s Orthodox Jewish enclaves, Los Angeles’ Persian neighborhoods. Each has its own culture derived primarily from the ancestries and culture of the residents who call these neighborhoods home. Likewise, each neighborhood in America has its own culture – some more unique than others – based on lifestyle, occupations, the types of households – and importantly – on the ethnicities and ancestries of the people who live in the neighborhood. Understanding where people came from, who their grandparents or great-grandparents were, can help you understand how a neighborhood is today.

    In the Brentwood neighborhood in Los Angeles, CA, residents most commonly identify their ethnicity or ancestry as Irish (11.2%). There are also a number of people of German ancestry (10.6%), and residents who report Irania roots (9.2%), and some of the residents are also of Russian ancestry (8.9%), along with some English ancestry residents (7.0%), among others. In addition, 18.2% of the residents of this neighborhood were born in another country.

    The Neighbors: Languages

    The languages spoken by people in this neighborhood are diverse. These are tabulated as the languages people preferentially speak when they are at home with their families. The most common language spoken in the Brentwood neighborhood is English, spoken by 75.0% of households. Other important languages spoken here include Persian, Spanish and Italian.

    Getting to Work

    How you get to work – car, bus, train or other means – and how much of your day it takes to do so is a large quality of life and financial issue. Especially with gasoline prices rising and expected to continue doing so, the length and means of one’s commute can be a financial burden. Some neighborhoods are physically located so that many residents have to drive in their own car, others are set up so many walk to work, or can take a train, bus, or bike. The greatest number of commuters in Brentwood neighborhood spend between 15 and 30 minutes commuting one-way to work (38.6% of working residents), which is shorter than the time spent commuting to work for most Americans.

    Here most residents (81.2%) drive alone in a private automobile to get to work. In addition, quite a number also ride the bus to get to work (6.9%) and 5.3% of residents also carpool with coworkers, friends, or neighbors for their daily commute. In a neighborhood like this, as in most of the nation, many residents find owning a car useful for getting to work.

error: JoinHSHS.com is protected!